
Vocabulary Mastery Curves for Aeneid and Gallic War 2
Annotations
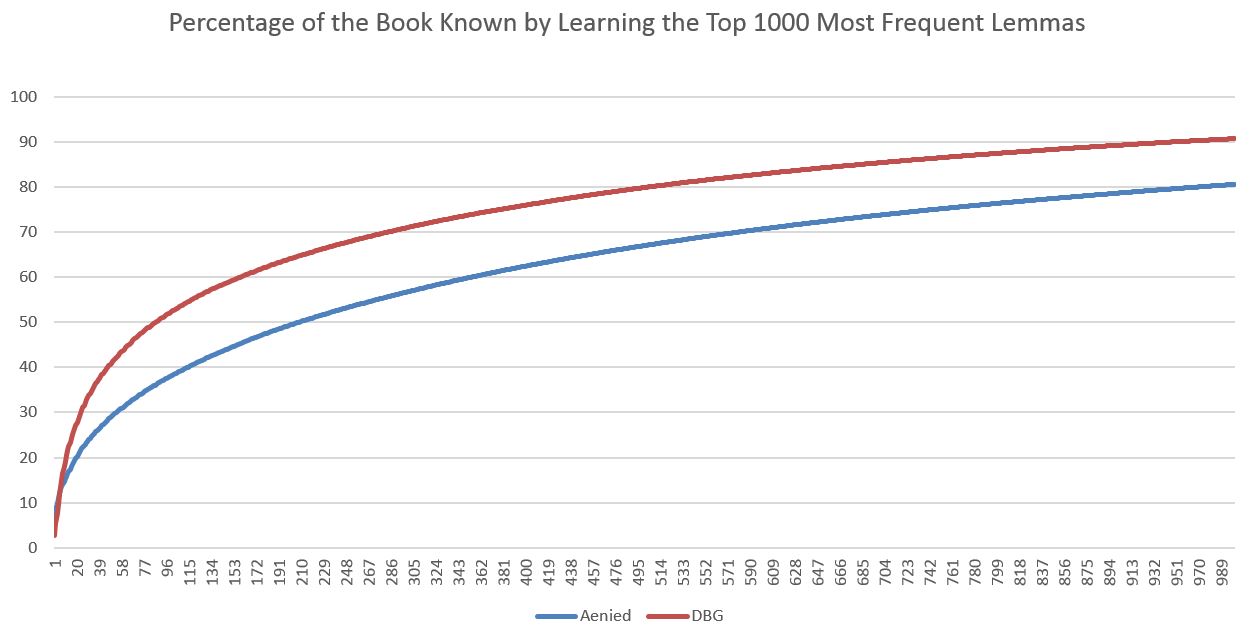
How many lemmata (dictionary headwords) does one have to master to read Latin comfortably? In the case of Vergil's Aeneid and Caesar's Gallic War the answer to this question can be represented as a graph, thanks to data collected by LASLA in a human inspetion and parsing of these texts. The graph here represents the percentage of all lemmata in the works which is accounted for by the top 1000 most frequent lemmata in those texts (excluding proper names). Knowing the 20 most frequent lemmata, along with the rules of Latin morphology, the reader will recognize 20% of word forms in the Aeneid and 28% of those in the Gallic War. Knowing 100 frequent lemmata, the reader will recognize 38% of word forms in the Aeneid and 52% of those in the Gallic War. The top 1,000 lemmata account for 81% and 91% of word forms, respectively).The LASLA data were analyzed by Seth Levin and Connor Ford. The visualization was produced by Seth Levin and Connor Ford using Excel.
